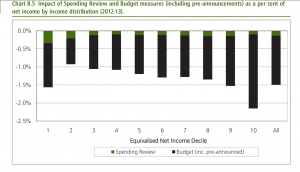
It takes, you know, quite a pair to publish the most drastic cuts in government spending since the end of the Second World War, when demand for Spitfires and tanks fell through the floor, and suffix it with a table that basically says the poor will be hit hardest. But that’s just what happened today. This is from page 99 of the 106 page spending review.
This graph is designed to show how badly affected sections of society will be as a percentage of their income level. It’s split into deciles by income level. The poorest tenth is the bar on the far left, by the way, the bar on the far right is the overall average.
This is according to treasury calculations and there are a lot of caveats. It’s worth pointing out that the bar second on the right is mostly made up of tax changes, as opposed to service withdrawal, which as we all know the very rich are good at avoiding.


Leave a Reply